Colorimetry in perspective of the human eye
Colorimetry is the science used to quantify color in perspective of the human eye
The science of measuring color and the appearance of color is vital: Perception of color is a subjective process where the brain responds to stimuli produced when incoming light reacts with the several different types of cone cells of the human eye. The way people perceive color is a subjective psychological phenomenon and is based upon the relation between wavelengths of the light detected by the rod and cone cells and the subsequent processing of those signals by neural pathways. Simply said: the same object illuminated by the same light source can be experienced differently by different people.
Understanding Human Tristimulus Vision
The human eye contains two different types of cells that contribute to human vision. Cone cells operate at high and medium levels of brightness, for example during daytime. Rod cells operate typically under low light conditions, for example at night.
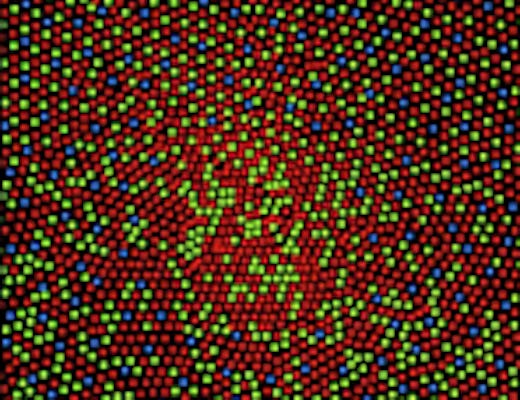
Human tri-stimulus vision is based on three different cone cell types, of which each covers a different wavelength range. Each type of cone cells has a specific spectral sensitivity in short (420 to 440 nm), middle (530 to 540 nm)(M), and long (560 to 580 nm, red) wavelengths. These ranges correspond roughly to blue (S), green (M) and red (L) colors. By combining the stimulation of (mixing) each cell type, we can see different colors.
At night or in the dark, human vision relies on rods as cones are not sensitive enough to provide sight. Rods are in contrast to cones much more sensitive but only come in one type instead of three. This single type has its own typical spectral response with a peak sensitivity around 507 nm. As rods only rely on a specific wavelength range which is not combined with other ranges, human night vision is monochromatic. In other words: the human eye is not able to discriminate colors when it’s dark at night.
The CIE 1931 Color Space
Although the actual average human eye’s response of S, M and L are known, colorimetry relies on other spectral sensitivity curves. Back in 1931 the International Commission on Illumination (CIE, Commission International de l’Éclairage – CIE in French) developed the still widely adapted CIE 1931 color space based on a series of experiments. Until then, there was no objective method for describing color in perspective of the human eye. The CIE model describes colors of any light emitting or reflecting object as a 3-dimensional value of wavelength parts that more or less cover colors we know as red green and blue. These values relate to X, Y and Z respectively and are translated into a two dimensional color space that covers all colors visible to the human eye.
The CIE 1931 color space was the first model that linked the distributions of wavelengths in the visible part of the electromagnetic spectrum, and colors perceived by the human eye. One should take into account that this model is, alike any other color model, a mathematical simplification of human (color) vision and based on a relatively small population. Still, such color models allow researchers to define and reproduce colors in most conventional situations and should be considered a tool for measuring color in applications such as display and lighting industry.
Defining a Standard Human Observer
Considering the fact that human color perception is fundamentally subjective, it is possible to work with standard human observer to objectively assess an object’s color. There are a number of standard human observers defined in colorimetry, including the 2° field of vision model as represented by the 1931 model. The 2° standard observer focuses on the high concentration of cones in the fovea whereas the 10° field model uses a broader field of view broadening the visual range. The CIE 1931 model 2° uses chromaticity as a function to describe the two important parameters: hue (color) and purity (saturation). A complete description of the color can be provided by measuring the luminance and chromaticity.
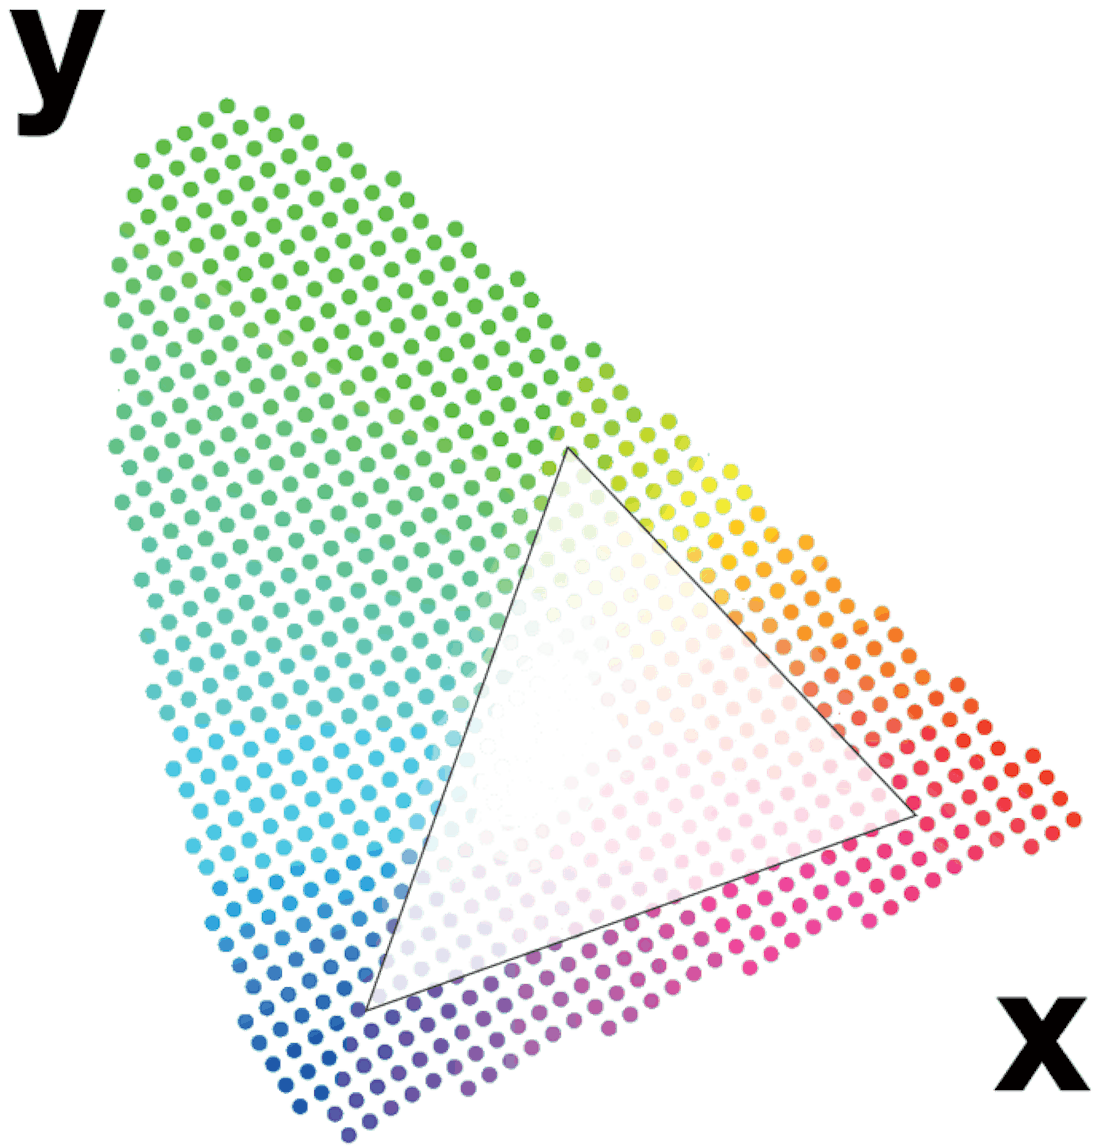
Chromaticity itself, also excluding the brightness component, can be plotted in a two-dimensional graph. The CIE 1931 Yxy color space directly transforms every visible color the human eye can see into a two dimensional horse shoe type layout. If we consider the color reproduction capabilities of an RGB emitting source, for example a RGB LED lamp, we can determine the exact area the light source can create. Once we know the color coordinates of each individual (red, green and blue) LED and plot this into the graph, a triangle can be drawn between these coordinates. This triangle is known as the color gamut of the source. The exact shape of this gamut entirely depends on the technology of the light source. For example: two different RGB LED light sources may cover a slightly different area as color points of LEDs of different bins may vary.

Example of a color gamut which is defined by the color coordinates of three primaries red, green and blue. Any color within the triangle can be made by mixing the primaries located at the vertices.
Applications of Colorimetry
Color and color reproduction has become more and more important with evolving technologies. Technological developments allow even faster and more accurate color measurement which found its way into many applications. For example brand identity has become more and more important to ensure the right color reproduction for example on TV. This is directly linked to capabilities of color reproduction on displays, but also in optimizing differences between different displays. For example the huge technological developments in smart phone displays offers brighter and more vivid color reproductions, but also requires proper and accurate calibration to ensure the exact same colors amongst millions of phones. For such applications, Admesy has developed in-line production colorimeters such as the Hyperion and 2D imaging colorimeters for full display inspection (Titan series).

